Bike Sharing Trends
Predicting bike sharing trends using classic machine learning methods (linear regression, decision tree)
With environmental issues and health becoming trending topics, usage of bicycles as a mode of transportation has gained traction. To encourage bike usage, cities across the world have successfully rolled out bike sharing programs. Under such schemes, riders can rent bicycles using manual/automated kiosks spread across the city for defined periods. In most cases, riders can pick up bikes from one location and return them to any other designated place. The bike sharing platforms from across the world are hotspots of all sorts of data, ranging from travel time, start and end location, demographics of riders, and so on. This data along with alternate sources of information such as weather, traffic, and so on makes it an attractive proposition for different research areas. The goal of this session is to predict the count of bike rental demand. To this end, we use bike sharing dataset with weather information using linear regression and decission tree.
Data Documentation
This dataset contains the hourly and daily count of rental bikes between the years 2011 and 2012 in the Capital bike share system with the corresponding weather and seasonal information.
The dataset contains more than 17k samples with 17 attributes
- record index
- date
- season : season (1:Spring, 2:Summer, 3:Fall, 4:Winter)
- year (0: 2011, 1:2012)
- month ( 1 to 12)
- hour (0 to 23)
- holiday : whether day is holiday or not
- weekday : day of the week (0 to 6)
- workingday : if day is neither weekend nor holiday is 1 otherwise is 0
-
weather_condition:
-
1: Clear, Few clouds, Partly cloudy
-
2: Mist + Cloudy, Mist + Broken clouds, Mist + Few clouds, Mist
-
3: Light Snow, Light Rain + Thunderstorm + Scattered clouds, Light Rain + Scattered clouds
-
4: Heavy Rain + Ice Pallets + Thunderstorm + Mist, Snow + Fog
-
- temp : Normalized temperature in Celsius. The values are divided to 41 (max)
- atemp: Normalized feeling temperature in Celsius. The values are divided to 50 (max)
- humidity: Normalized humidity. The values are divided to 100 (max)
- windspeed: Normalized wind speed. The values are divided to 67 (max)
- casual: count of casual users
- registered: count of registered users
- total_count: count of total rental bikes including both casual and registered
For more information please read the data documentation.
Code Explanation
Data Loading and Exploration
- The code reads the “Data.csv” file using pandas and displays basic information about the dataset, such as the number of rows and columns.
- It checks for missing values and performs some initial exploratory data analysis (EDA) by showing summary statistics.

Feature Engineering
- The notebook creates new features from existing ones. For example, it extracts the hour from the timestamp column to create a new feature called “hour_of_day”.
- It also creates a “weekday” feature to represent the day of the week.
Data Visualization
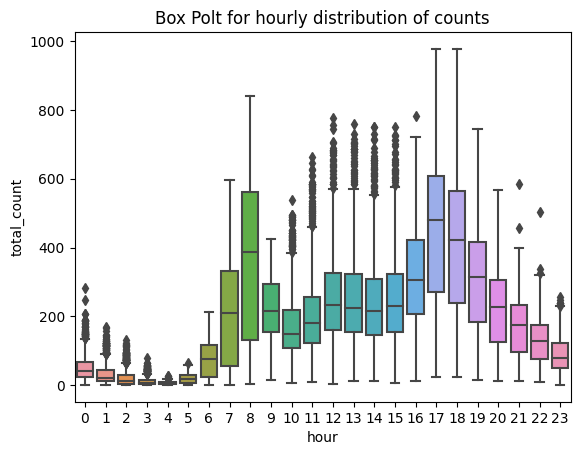
- The code generates various plots using libraries like matplotlib and seaborn. These plots visualize trends in bike-sharing data, such as hourly usage patterns, daily usage, and seasonal variations.
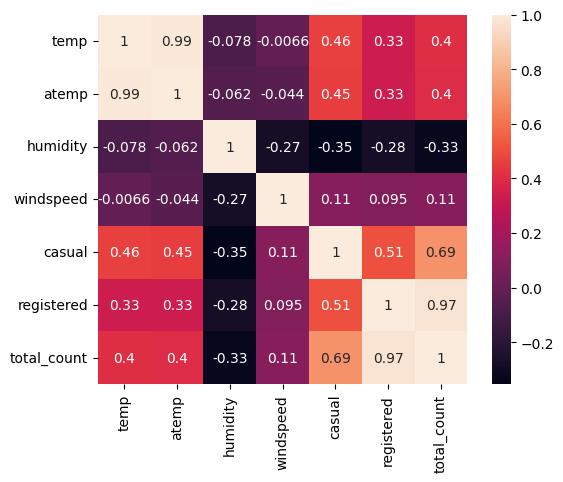
- Examples include a bar plot showing average bike rentals by hour, a line plot of daily rentals over time, and a heatmap of correlations between features.

Model Building and Evaluation
- The notebook splits the data into training and testing sets.
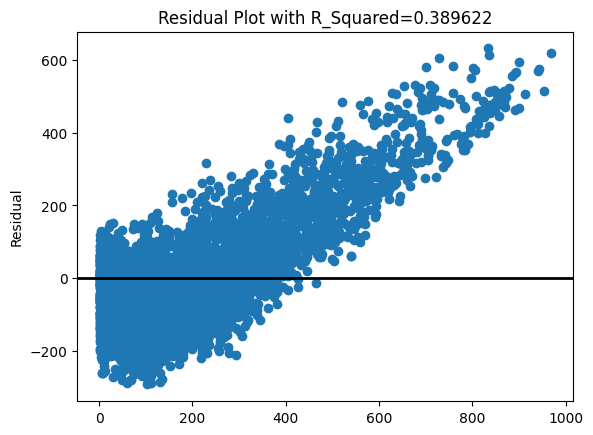
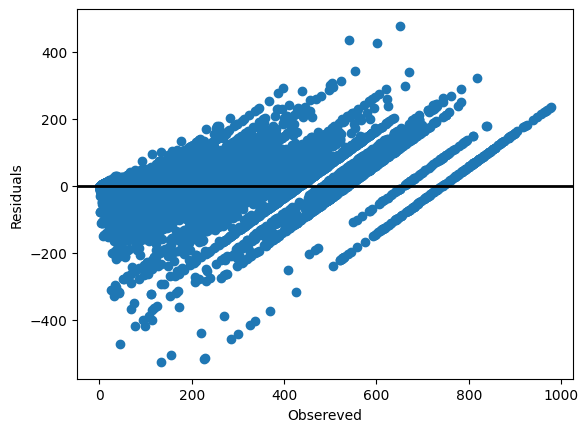
- It trains machine learning models (e.g., linear regression, random forest) to predict bike rentals based on features like temperature, humidity, and wind speed.
- Model performance metrics (e.g., RMSE) are calculated to evaluate model accuracy.

